Today in Studio we had the pleasure of hearing from artist Joelle Bitton about her personal and professional creative work, at such places as Media Lab Europe, as well as her creative process and ideation techniques. Her works and talk were interesting and inspiring. Check her out!
After hearing from Joelle, we split into small groups to discuss our progress on our Mini Thesis projects since we last presented. The feedback I received from my group is after the jump.
A few projects were suggested to me as precedents/inspiration:
Hindsight Is Always 2020 by R. Luke Dubois is a data visualization of keywords from historical US Presidents’ State of the Union addresses. The artist explains that “the address is in many ways the best original source material for elucidating the concerns and anxieties apparent in the national zeitgest for a given time.” Keywords from each address are displayed using standards of the Snellen Chart for optical acuity (see here), with the most prevalent words printed the biggest, least prevalent (of the most prevalent) printed smallest. I love the simplicity of this visualization and the rich contextual story that it tells.
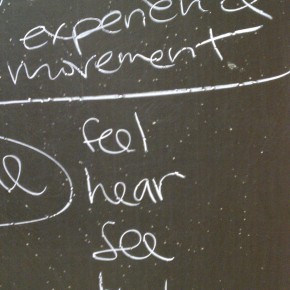
Water, Nature, Chaos is a current exhibit at Technorama – The Swiss Science Center in Zurich, Switzerland. This exhibit aims to present “many of the earth’s phenomena […] in scaled-down versions so that [users] can experience them in a perceivable scale of time and space.” One of the features focuses on earthquakes, which reminded my classmate of my project. I like the idea of providing an experience in a “perceivable scale of time and space”, but after other feedback, I am not sure how literally I want users to experience an earthquake.
Unheeded Advice is a Chinese data visualization experience which shows news stories related to global warming. Through user interaction with both physical and digital interfaces, a story is told about the effects of this issue and its media coverage. This project is a great reference for what I want to do.
Other concepts that came up in our discussion:
- human/social richter scale
- data visualization that is “agitated” by user input
- data changing balance
- is Twitter a limited/biased population?
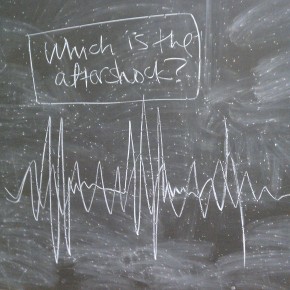
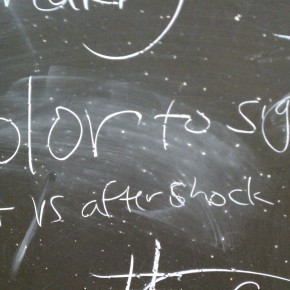
- after shocks and effects